
P/E Ratio Explained How to Tell If a Stock Is Cheap or Expensive
- Details
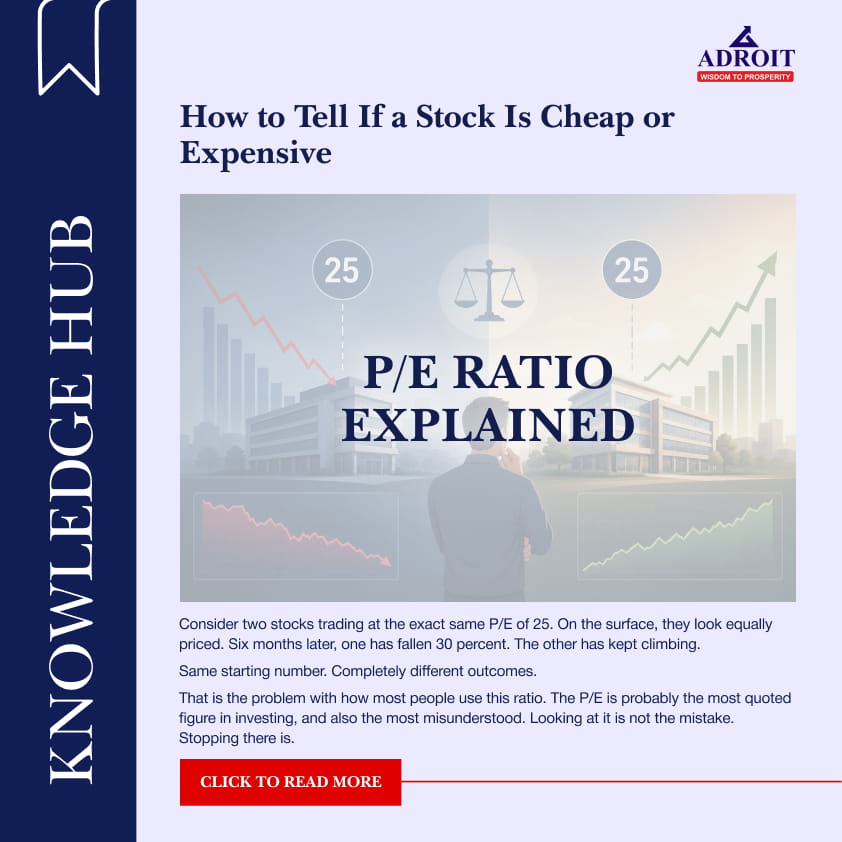
P/E Ratio Explained: How to Tell If a Stock Is Cheap or Expensive
Consider two stocks trading at the exact same P/E of 25. On the surface, they look equally priced. Six months later, one has fallen 30 percent. The other has kept climbing.
Same starting number. Completely different outcomes.
That is the problem with how most people use this ratio. The P/E is probably the most quoted figure in investing, and also the most misunderstood. Looking at it is not the mistake. Stopping there is.
What P/E Actually Measures
Price to Earnings is the current share price divided by the company's earnings per share. A stock at Rs 500 with an EPS of Rs 25 has a P/E of 20. In simple terms, it tells you how much you are paying today for every rupee the company earns.
Two versions exist. Trailing P/E uses the last twelve months of actual, reported earnings. Forward P/E uses what analysts expect the company to earn ahead. A stock can look pricey on trailing numbers and quite reasonable on forward ones, if earnings are genuinely set to grow. Worth checking which one you are even looking at before forming an opinion.
Why the Number Alone Can Mislead You
A P/E of 20 could be a steal for one company and overpriced for another. On its own, the ratio says nothing about growth, debt, or the quality of the business behind it.
This is where the confusion usually starts. A low P/E gets read as undervalued, almost by reflex. Sometimes that is true. Often it is not. The market may have already priced in slowing growth or a weakening business, and the low number is simply reflecting that reality, not hiding an opportunity. Cheap on paper and cheap for a reason are not the same thing, and telling them apart is the actual skill here.
P/E Only Works for Certain Kinds of Companies
This is the part most explainers skip, and it matters more than the formula itself. P/E works only when earnings are stable and genuinely reflect how the business is doing. The moment earnings turn lumpy, cyclical, or negative, the ratio starts lying to you.
It holds up reasonably well for businesses where profit doesn't swing much from year to year. FMCG and consumer staples companies see demand that barely moves. IT services firms run on contracted revenue with margins that don't jump around. Pharma companies with a stable domestic or export base fall in the same bucket, and so do established manufacturers with steady, predictable order books.
This year's profit is a fair stand in for next year's. That's the one condition P/E actually needs to work.
Now flip it around. Banks and NBFCs see a single year's profit swing with provisioning and interest rate cycles, so it rarely reflects the real health of the loan book. Price to Book works better there, since it compares price to actual assets on the balance sheet.
Real estate and infrastructure companies book revenue project by project, so earnings jump around even in a genuinely healthy business. Net Asset Value or EV to EBITDA gives a steadier read in these cases.
Capital intensive cyclicals like metals, cement, and oil and gas move with commodity prices. During a boom, profits peak and P/E can look artificially low, which is often the top of the cycle rather than a bargain. The reverse happens during a downturn. EV to EBITDA measured across a full cycle avoids this trap.
Loss making or early stage companies, including a lot of newer tech listings, have no profit and therefore no P/E to calculate, so Price to Sales or EV to Revenue fills that gap. Insurance companies are a smaller but real exception too, since much of their value sits in future policy cash flows that haven't been booked as profit yet, which is why embedded value is the number analysts actually track.
So the first question is never whether a P/E looks high or low. It's whether P/E is even the right tool for that business.
How to Tell If a P/E Is Actually Justified
Even in industries where P/E is the right tool, a standalone number still won't tell you much. A few checks make it useful.
Compare it to the sector average, not to a fixed number like 15 or 30 in your head. A P/E of 30 is cheap next to peers trading at 45, and expensive next to peers trading at 18.
Compare it to the company's own history too. If a stock has traded between 20 and 25 for years and suddenly sits at 12, that gap deserves an explanation, not an assumption of a bargain.
A quick PEG check helps as well. Divide the P/E by the expected earnings growth rate, and you'll often find a P/E of 40 against 35 percent growth is more reasonably priced than a P/E of 15 against 5 percent growth, even though the second one looks cheaper at first glance.
Same Company, Two Very Different Stories
Take this example company, a mid sized consumer goods business, at two points in its journey.
A few years in, it was trading in the mid 40s on P/E, while the rest of the sector sat in the mid 20s. On the surface, expensive. But it was expanding into new markets, growing earnings at a fast clip, and carrying almost no debt. The high P/E wasn't the market being irrational. It was the market pricing in growth that hadn't shown up in the numbers yet. Investors who dismissed it as overpriced watched earnings eventually catch up to the price over the next couple of years.
Later, growth slowed as the expansion matured and competition caught up. The P/E drifted down into the high teens, below the sector average. On paper, a value pick. In reality, margins were under pressure and earnings had stalled. The low P/E wasn't a hidden opportunity. It was the market correctly pricing in a weaker business. Investors who bought on the number alone weren't buying value. They were buying a slowdown.
Same company. Same ratio. Two completely different meanings, and the number itself never explained which one was true. Only the context around it did.
A Quick Checklist Before You Trust Any P/E Number
• Confirm P/E is even a meaningful metric for that industry
• Check whether you're looking at trailing or forward P/E
• Compare it to the sector average, not a number you've memorised
• Compare it to the company's own historical P/E range
• Run a PEG check to see if the P/E is backed by real growth
• Check debt and earnings quality before assuming a low P/E means undervalued
Never Read P/E in Isolation. Pair It With Other Ratios
Even in the right industry, with the right comparison, P/E alone is only one lens. Serious investors always pair it with other ratios that test the number from a different angle.
The PEG ratio, as covered above, checks whether the valuation is justified by growth. Return on Equity measures how efficiently a company uses shareholder capital to generate profit. Two companies can carry the same P/E while one has a consistently higher ROE, and that one is usually the better quality business, often deserving a premium.
Debt to Equity matters too. A company can show attractive earnings and a low P/E while carrying heavy debt that makes those earnings fragile, so checking leverage alongside P/E avoids mistaking a leveraged bet for a cheap stock.
Price to Book works as a useful cross check, especially for asset heavy businesses, since it shows what you're paying relative to the company's net assets rather than just its current profit. Free Cash Flow yield rounds this out well, because earnings can be shaped by accounting choices while free cash flow is harder to dress up. Comparing it against the P/E driven valuation helps confirm whether the profit number is real cash or just paper profit.
None of these ratios replace P/E. Used together, they either confirm what the P/E is suggesting, or reveal that the P/E is telling an incomplete story.
What P/E Tells You About Valuation
At its core, P/E is a shorthand for market expectations. A high P/E is the market betting on strong future growth. A low P/E usually reflects the market expecting slower growth or higher risk. Reading P/E for valuation means asking whether that expectation is reasonable, not just whether the number itself looks big or small.
This shows up in practice two ways. First, P/E can be used to estimate a rough fair value. If a company earns Rs 20 per share and similar businesses in its sector consistently trade at a P/E of 22, a fair value estimate would sit in the range of Rs 440 per share, assuming the company's growth and risk profile genuinely match its peers.
Second, P/E works as a relative valuation check across time. Comparing today's P/E to the same company's five or ten year average shows whether the market currently views the business more or less favourably than it has historically, and whether that shift is backed by a real change in the business or is simply sentiment.
Used this way, P/E stops being a single verdict on cheap or expensive. It becomes a tool for testing whether the price being paid today matches a reasonable view of the company's future.
The Takeaway
P/E isn't a verdict. It's a starting point for a better question. The number only means something once you know whether the industry supports using it, how it stacks up against history and peers, and whether the growth behind it is real.
So the next time a P/E looks obviously cheap or obviously expensive, resist the urge to accept it at face value. Ask what it's actually telling you. Sometimes the more useful answer is that it isn't the right question for that business at all.
Disclaimer:
Adroit Financial Services Private Limited (hereinafter referred to as "Adroit"), Registered Address: F-912, Titenium City Center, Nr. Sachin Towers, 100 Feet Ring Road, Anand Nagar, Manekbag, Ahmedabad, Ahmadabad City, Gujarat, India, 380015.
Correspondence Address: 401-402, Fourth Floor, Angel Mega Mall, Plot No. CK1, Kaushambi, Ghaziabad, Uttar Pradesh, India, 201010.
Registration Numbers: CIN: U74899GJ1994PTC128736 | SEBI Registration Numbers: NSE, BSE, MCX & NCDEX: INZ000173137 |Member Code: BSE-3034, NSE- 08538, MCX- 56790 & NCDEX- 01302 | DP- NSDL/CDSL- IN-DP-551-2021 | Research Analyst: INH100003084 | Portfolio Management Services (PMS): INP000005349 | Mutual Fund: ARN- 30091.
Standard Disclaimer: Investments in the securities market are subject to market risk, read all the related documents carefully before investing. This is for educational purposes and does not provide any advice/tips on Investment or recommend buying and selling of any stock. Adroit or its associates has not been debarred/ suspended by SEBI or any other regulatory authority for accessing/ dealing in securities Market. Adroit or its associates/analyst has not received any compensation/ managed or co-managed public offering of securities of the company covered by Analyst during the past twelve months. This document is solely for the personal information of the recipient, and must not be singularly used as the basis of any investment decision. Nothing in this document should be construed as investment or financial advice. Each recipient of this document should make such investigations as they deem necessary to arrive at an independent evaluation of an investment in the securities of the companies referred to in this document (including the merits and risks involved), and should consult their own advisors to determine the merits and risks of such an investment. The information in this document has been printed on the basis of publicly available information, internal data and other reliable sources believed to be true, but we do not represent that it is accurate or complete and it should not be relied on as such, as this document is for general guidance only. Neither Adroit, nor its directors, employees or affiliates shall be liable for any loss or damage that may arise from or in connection with the use of this information. Adroit Financial Services Private Limited has not independently verified all the information contained within this document. Accordingly, we cannot testify, nor make any representation or warranty, express or implied, to the accuracy, contents or data contained within this document.
Margin Trading Funding (MTF) is subject to provisions of SEBI circular
CIR/MRD/DP/54/2017 dated June 13,2017 and the terms and conditions mentioned in the rights and obligations statement issued by Adroit Financial Services Private Limited.
Read More On: www.adroitfinancial.com